 Web Server Statistics for dspmusic.org Web Server Statistics for dspmusic.org
(Go To: Top: General Summary: Daily Summary: Hourly Summary: Domain Report: Organization Report: Operating System Report: Status Code Report: File Size Report: File Type Report: Directory Report: Request Report)
This report contains overall statistics.
Successful requests: 12,744
Average successful requests per day: 12,743
Successful requests for pages: 11,551
Average successful requests for pages per day: 11,550
Failed requests: 363
Redirected requests: 15
Distinct files requested: 234
Distinct hosts served: 391
Data transferred: 1.29 gigabytes
Average data transferred per day: 1.29 gigabytes
(Go To: Top: General Summary: Daily Summary: Hourly Summary: Domain Report: Organization Report: Operating System Report: Status Code Report: File Size Report: File Type Report: Directory Report: Request Report)
This report lists the total activity for each day of the week, summed over all the weeks in the report.
Each unit ( ) represents 300 requests
for pages or part thereof.
) represents 300 requests
for pages or part thereof.
day: #reqs: #pages: ---: -----: ------: Sun: 2: 2:
(Go To: Top: General Summary: Daily Summary: Hourly Summary: Domain Report: Organization Report: Operating System Report: Status Code Report: File Size Report: File Type Report: Directory Report: Request Report)
This report lists the total activity for each hour of the day, summed over all the days in the report.
Each unit () represents 20 requests
for pages or part thereof.
hour: #reqs: #pages: ----: -----: ------: 0: 387: 334:2: 378: 331:
10: 373: 321:
(Go To: Top: General Summary: Daily Summary: Hourly Summary: Domain Report: Organization Report: Operating System Report: Status Code Report: File Size Report: File Type Report: Directory Report: Request Report)
This report lists the countries of the computers which requested files.
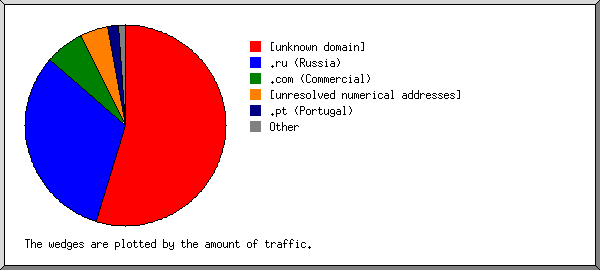
Listing domains, sorted by the amount of traffic.
#reqs: %bytes: domain
-----: ------: ------
 1769: 54.56%: [unknown domain]
 7973: 31.70%: .ru (Russia)
  434:  6.40%: .com (Commercial)
 1171:  4.53%: [unresolved numerical addresses]
   15:  1.73%: .pt (Portugal)
  882:  0.80%: .net (Networks)
    5:  0.11%: .ua (Ukraine)
   93:  0.07%: [domain not given]
   43:  0.03%: .arpa (Arpanet)
    2:  0.03%: .cn (China)
    4:  0.02%: .it (Italy)
   15:  0.01%: .ca (Canada)
    8:  0.01%: .co (Colombia)
    6:       : .gr (Greece)
    5:       : .ec (Ecuador)
    4:       : .ee (Estonia)
    3:       : .br (Brazil)
    4:       : .fr (France)
    6:       : .cz (Czech Republic)
    1:       : .hk (Hong Kong)
    1:       : .de (Germany)
  300:       : .ws (Samoa)
(Go To: Top: General Summary: Daily Summary: Hourly Summary: Domain Report: Organization Report: Operating System Report: Status Code Report: File Size Report: File Type Report: Directory Report: Request Report)
This report lists the organizations of the computers which requested files.
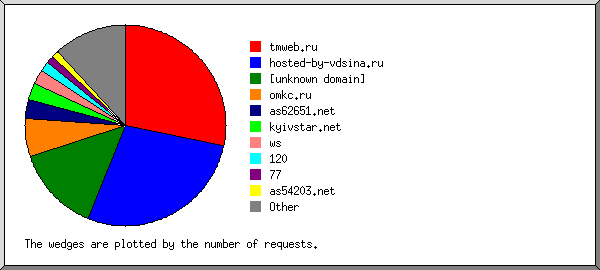
Listing the top 20 organizations by the number of requests, sorted by the number of requests.
#reqs: %bytes: organization
-----: ------: ------------
 3613:       : tmweb.ru
 3525: 31.07%: hosted-by-vdsina.ru
 1769: 54.56%: [unknown domain]
  789:  0.58%: omkc.ru
  378:  0.28%: as62651.net
  352:  0.26%: kyivstar.net
  300:       : ws
  206:  0.15%: 120
  164:  0.11%: 77
  141:  0.10%: as54203.net
  130:  0.10%: 112
  116:  4.61%: semrush.com
  107:  0.08%: 185.108
  100:  0.07%: chinaunicom.com
   93:  0.07%: [domain not given]
   87:  0.01%: 91
   86:  0.06%: 174.138
   55:  0.04%: 41
   47:  0.03%: netvigator.com
   47:  0.17%: webmeup.com
  639:  7.63%: [not listed: 108 organizations]
(Go To: Top: General Summary: Daily Summary: Hourly Summary: Domain Report: Organization Report: Operating System Report: Status Code Report: File Size Report: File Type Report: Directory Report: Request Report)
This report lists the operating systems used by visitors.
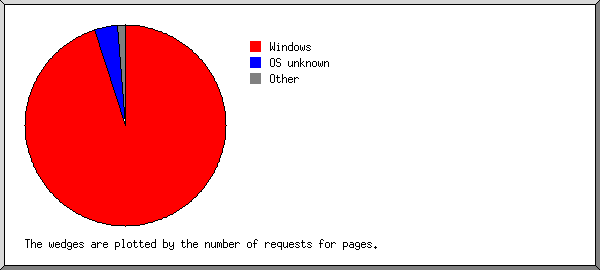
Listing operating systems, sorted by the number of requests for pages.
 #: #reqs: #pages: OS
--: -----: ------: --
 1: 12126:  10975: Windows
  :  4366:   3883:   Windows NT
  :  3691:   3664:   Windows XP
  :  4069:   3428:   Unknown Windows
 2:   450:    440: OS unknown
 3:    83:     79: Known robots
 4:    44:     35: Macintosh
 5:    37:     21: Unix
  :    37:     21:   Linux
(Go To: Top: General Summary: Daily Summary: Hourly Summary: Domain Report: Organization Report: Operating System Report: Status Code Report: File Size Report: File Type Report: Directory Report: Request Report)
This report lists the HTTP status codes of all requests.
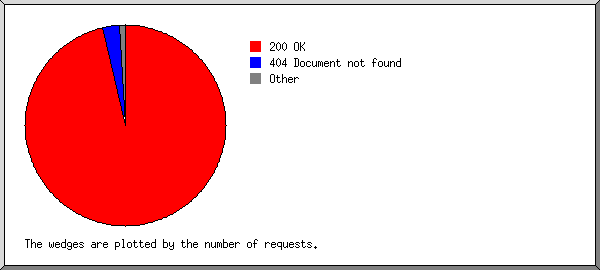
Listing status codes, sorted numerically.
#reqs: status code
-----: -----------
12647: 200 OK
   83: 206 Partial content
   14: 301 Document moved permanently
    1: 302 Document found elsewhere
   14: 304 Not modified since last retrieval
  363: 404 Document not found
(Go To: Top: General Summary: Daily Summary: Hourly Summary: Domain Report: Organization Report: Operating System Report: Status Code Report: File Size Report: File Type Report: Directory Report: Request Report)
This report lists the sizes of files.
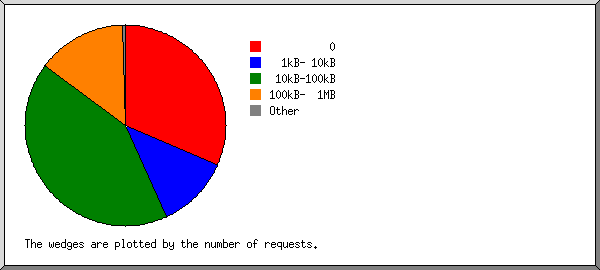
       size: #reqs: %bytes:
-----------: -----: ------:
          0:  4010:       :
   1B-  10B:     1:       :
  11B- 100B:     0:       :
 101B-  1kB:    36:       :
  1kB- 10kB:  1503:  0.40%:
 10kB-100kB:  5345:  3.98%:
100kB-  1MB:  1839: 93.09%:
  1MB- 10MB:    10:  2.53%:
(Go To: Top: General Summary: Daily Summary: Hourly Summary: Domain Report: Organization Report: Operating System Report: Status Code Report: File Size Report: File Type Report: Directory Report: Request Report)
This report lists the extensions of files.
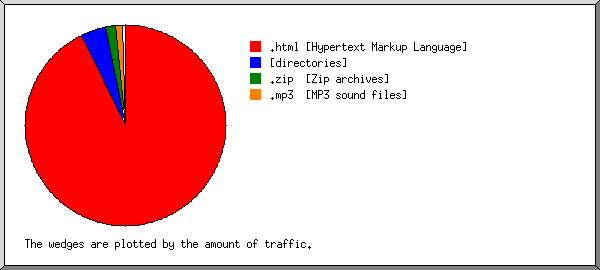
Listing extensions with at least 0.1% of the traffic, sorted by the amount of traffic.
#reqs: %bytes: extension
-----: ------: ---------
 1848: 92.77%: .html [Hypertext Markup Language]
 9703:  4.17%: [directories]
    4:  1.55%: .zip  [Zip archives]
    8:  1.06%: .mp3  [MP3 sound files]
   18:  0.17%: .jpg  [JPEG graphics]
 1106:  0.16%: .php  [PHP]
   30:  0.10%: .current
   27:  0.01%: [not listed: 5 extensions]
(Go To: Top: General Summary: Daily Summary: Hourly Summary: Domain Report: Organization Report: Operating System Report: Status Code Report: File Size Report: File Type Report: Directory Report: Request Report)
This report lists the directories from which files were requested. (The figures for each directory include all of its subdirectories.)
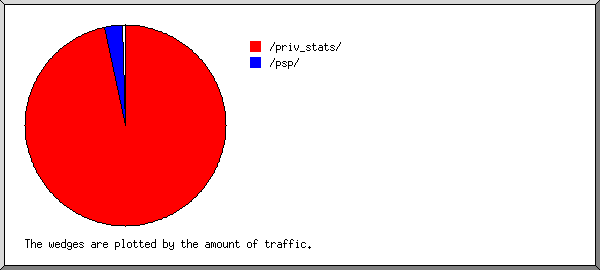
Listing directories with at least 0.01% of the traffic, sorted by the amount of traffic.
#reqs: %bytes: directory
-----: ------: ---------
10729: 96.75%: /priv_stats/
   71:  2.79%: /psp/
  682:  0.22%: [root directory]
 1144:  0.18%: /wp/
   81:  0.06%: http://
   37:       : [not listed: 7 directories]
(Go To: Top: General Summary: Daily Summary: Hourly Summary: Domain Report: Organization Report: Operating System Report: Status Code Report: File Size Report: File Type Report: Directory Report: Request Report)
This report lists the files on the site.
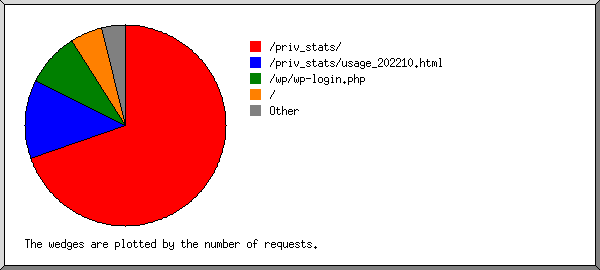
Listing files with at least 20 requests, sorted by the number of requests.
#reqs: %bytes:          last time: file
-----: ------: ------------------: ----
 8865:  3.88%: Oct/30/22 12:00 AM: /priv_stats/
 1629: 84.02%: Oct/30/22 12:00 AM: /priv_stats/usage_202210.html
 1101:  0.16%: Oct/29/22 11:57 PM: /wp/wp-login.php
   11:       : Oct/29/22 11:51 PM:   /wp/wp-login.php?action=lostpassword
  665:  0.21%: Oct/29/22 11:59 PM: /
   81:  0.06%: Oct/29/22 11:51 PM: http://dspmusic.org/priv_stats/
   30:  0.10%: Oct/29/22  7:21 PM: /priv_stats/webalizer.current
  373: 11.56%: Oct/29/22 11:59 PM: [not listed: 184 files]
(Go To: Top: General Summary: Daily Summary: Hourly Summary: Domain Report: Organization Report: Operating System Report: Status Code Report: File Size Report: File Type Report: Directory Report: Request Report)


